NEWS
Artificial intelligence technology & data value + innovative development
give guidance to reading
[deer smart | Lecture] · Artificial intelligence technology & data value, this is the next part of the chilled water system topic —— optimization control strategy (thanks: due to reference sources reprint or adaptation, copyright belongs to the original author, here to thank the original author!)
Mo Deering-based optimization control algorithm
First, each equipment is mo Deer, and the operation optimization problem of the freezing system is constructed based on the mo Deer, and various optimization algorithms are used to solve the objective function.(Using mathematical methods to analyze / solve the physical characteristics) With the development of algorithms, more and more optimization algorithms are applied to the optimization control method of chiller, and their convergence and global optimization effect are getting better and better, but in essence, they are mo Deer-based optimization methods.
The mo Deer-based optimization control strategy is to build a system or a specific equipment mo Deer
Main functions of the mo Deer:
(1) To simulate the energy consumption and cost of the system and the response of the system to the change of control variables;
(2) The relationship between the design variables and the target function can be obtained;
(3) The control strategy takes a certain variable as the optimization variable, creates the objective function, and uses the optimization algorithm to find the optimal solution of the objective function;
In the chiller system, the optimization variables are generally the start-stop state of the chiller, the load distribution of each chiller, and the outlet temperature of chilled water; the target function is generally the indoor temperature, energy consumption or cost, etc.
Chilled water system mo Deer type
Chiller physical mo Deer and (expert / experience) mathematical mo Deer
The physical mo Deer of chiller is usually very detailed and accurate, which can react the performance of chiller more accurately, which is conducive to the formulation of control strategy. However, in practical applications, many parameters in physical mo Deers are often difficult to measure. At the same time, solving the governing equation of the physical mo Deer is usually very complex. Therefore, control strategies based on physical mo Deers are generally difficult to use in practical applications. Most of the frozen water system simulation software is simulated by building a physical moDeer. The empirical mo Deer of chiller is relatively simple, and the calculation cost is generally controllable, so it is more suitable for practical application.
(1) Optimization control based on the physical mo Deer
-----Many parameters in physical mo Deer are often difficult to measure; solving the control equation of physical mo Deer is very complicated.
(2) Optimization control based on the mathematical mo Deer
-----The effect depends on the quality of the chiller mo Deer and the optimization effect of the optimization algorithm. However, it is difficult to always maintain the accuracy of the fitted mo Deer in the practical application of variable working conditions. At the same time, it is difficult to maintain the optimization effect and the calculation speed, which are crucial for the optimal control and online control of the chiller system.
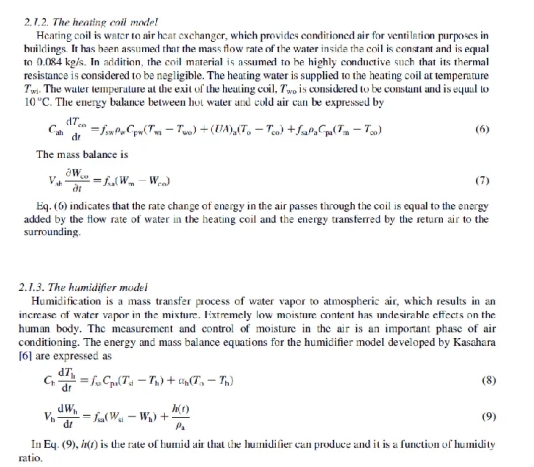
Physical characteristic mo Deer of the frozen host
(Specific heat capacity coefficient, air heat conduction coefficient, air / water flow heat transfer coefficient, etc.)
Frozen host mathematical mo Deer
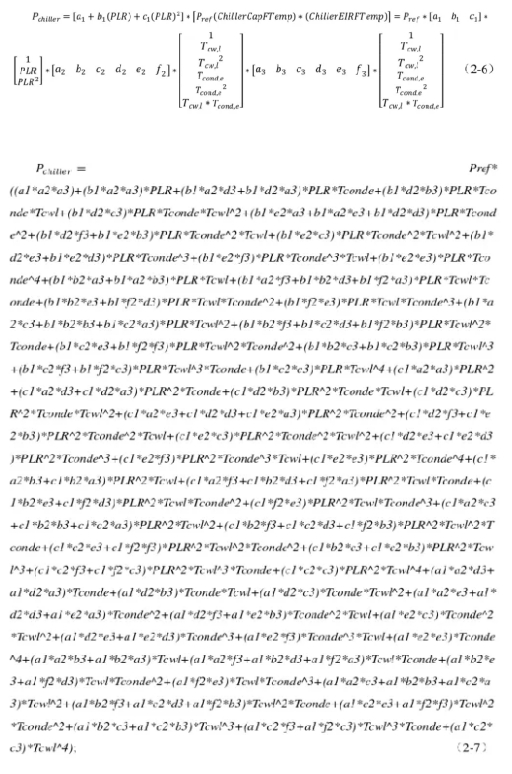
By ENERGY PLUS + Engineering Referent in the literature data. Reference shows that, for the mathematical mo Deer of centrifugal chiller:
The actual operating energy consumption of the chiller is a nonlinear function related to parameters such as PLR, Twc and Tcond, where PLR is determined by the cooling load required by the central air conditioning system, and Twc and Tcond are the temperature control set points given during the operation of the chiller.
The formula is:
Physical mo Deer of cooling tower
The mathematical mo Deer of variable speed cooling tower is based on the fitting of empirical performance curve and performance data or experimental results of manufacturer samples. When establishing the performance curve of the cooling tower, we should first know some rated parameters of the cooling tower, including the dry ball temperature of the inlet air, maximum air volume, water volume, fan power, outlet water temperature and various parameters under the design condition.

In the formula: Approach 1- -The difference between the water temperature at the cooling tower outlet and the air temperature at the fan inlet is (℃)
Fair: One air flow rate, the actual air flow divided by the rated air flow;
FR water: One water flow rate, for the actual water flow divided by the rated water volume;
The temperature difference of Twb a cooling tower is (℃)
Tr-air wet ball temperature (℃);
C1-C35.
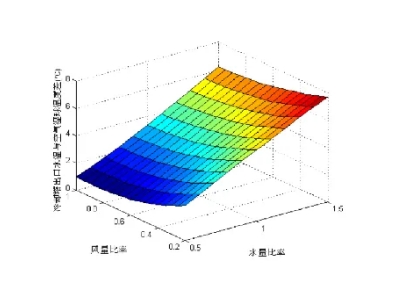
The change of water quantity and air volume has a great influence on the cooling effect, and the change of water quantity has a greater impact, which is almost linear. The change of air volume has a smaller impact on the cooling effect when the air volume is large, but has a greater impact on the cooling effect when the air volume is small
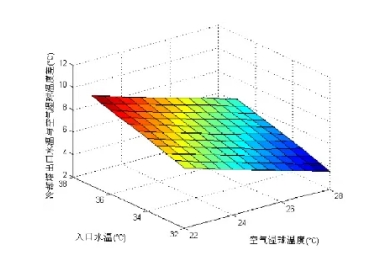
The cooling capacity is linearly related to the air wet bulb temperature and inlet water temperature.
Optimization control strategy based on chiller performance diagram
The operation data of the chiller generates the performance map of the chiller, which is used to describe the performance of the chiller under different operating conditions, and uses the performance map of the chiller to guide the optimal control strategy of the chiller.
The performance chart can optimize the start and stop control and load distribution of the chiller and update the performance chart of the chiller regularly with the operation data, which further improves the accuracy of the chiller performance chart and the optimization effect of the control strategy.
Optimization algorithm based on performance diagram: obtain the performance diagram of chiller based on the operation data under different operating conditions, and find the best operating condition under current operating conditions according to the performance diagram. The optimization algorithm avoids mo Deering and optimization process and is suitable for online real-time optimization control; but the performance chart is generated in advance based on actual operation data or simulation data for online real-time search, and cannot optimize the working conditions beyond the performance chart, so the performance chart has high requirements on the quality, quantity and type of operating data
After obtaining a large number of data points located on the performance envelope of chiller, the fitting surface can be approximately considered as the performance envelope of chiller. The performance envelope of chiller is the upper boundary line of the performance diagram of chiller. The closer the data point is to the performance envelope of chiller, the higher the operation efficiency.
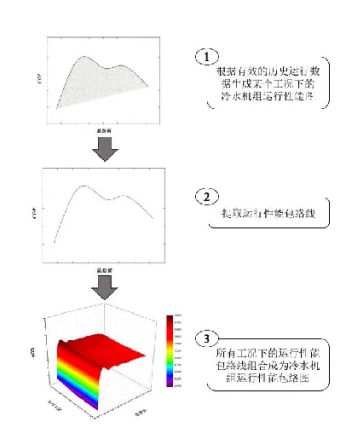
The specific steps to obtain the chiller operating performance envelope diagram are as follows:
Step 1: Based on a large amount of effective historical operation data, generate the operation performance chart of chiller under different working conditions; set the instantaneous COP value under different loads and set different temperature / temperature difference.
Step 2: From the operation performance diagram of the chiller to the operation performance envelope of the chiller under different working conditions.
Step 3: Combine the operation performance envelope of the chiller under all working conditions into the operation performance envelope diagram of the chiller.
Problems ized control strategy based on Chiller performance chart
1) Abnormal data destroys the quality of performance graph
----The optimization control based on the performance diagram is generally based on the operation data of the chiller performance diagram under different operating conditions. In the practical application process, because the measurement data has dynamic characteristics and noise interference, it has great fluctuations and errors, which leads to the obtained performance map optimization effect is greatly reduced.
2) Insufficient operating data or uneven distribution
----Performance diagrams are generated based on actual operation data or simulation data in advance. In practical applications, the historical operation data of chillers is insufficient or the distribution of operation data is uneven. When the historical operation data is insufficient, only incomplete performance diagrams can be obtained, which affects the effect of subsequent optimization control.
3) Performance diagram update and generation
-----With the change of the service life of the chiller system, its operation performance will gradually decline, and its performance chart will also change. Therefore, it is necessary to update the performance chart regularly to ensure its optimization effect. However, the update and generation of the performance chart in the online control have certain requirements on the generation speed of the performance chart.
Optimized control strategy based on the Chiller performance chart
The measured values of each variable in the chiller collected on the site are collected by the sensor. Because the error is inevitable, there will be a certain deviation between the data value of the variables collected on the site and the true value.
Due to the varying measurement uncertainties of sensors, there can be errors in the measured values such as chilled water flow rate, inlet temperature of chilled water, and outlet temperature of chilled water. This, in turn, leads to errors in the cooling load (cooling capacity). The cooling load is a critical parameter; it serves as a logical criterion in control strategies and is crucial for the final measurement of COP.
The deviation of the cooling load measurement value will not only cause the accuracy of the operation performance envelope diagram, but also lead to the failure to accurately match the corresponding operation data points in the envelope diagram, which will cause the deviation of the operation guidance of the control strategy to the chiller, so as to make the system run at the best operating point.
In practical application, the value of cooling load is generally calculated from the total flow of frozen water and the temperature difference of frozen water,

The inaccuracy of the cold load value is caused by the inaccurate measurement value of variables such as the total flow rate of the frozen water and the water temperature in and out of the frozen water. The reasons for the inaccurate measurement value are mainly divided into abnormal measurement value and error. The error is persistent, which may lead to continuous inaccuracy and reduce the reliability of the cooling load measurements.
Data fusion + device mechanism mo Deer optimization control algorithm
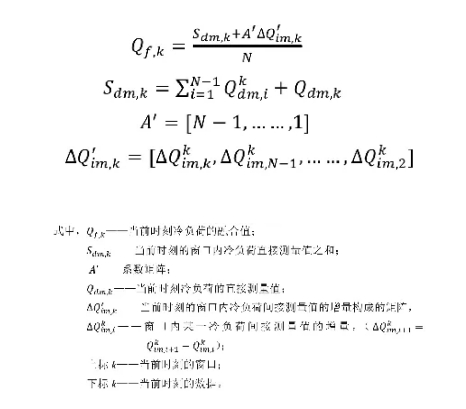
Data fusion is to integrate the direct measured value and the indirect measured value of the cooling load together. By judging the change relationship between the direct measured value of the cooling load and the indirect measured value, the fusion value of the cooling load is reorganized, so as to enhance the reliability of the cooling load measurement results.
Objective: To correct the measured value of the cooling load
Direct and indirect measurement of the cooling load value:
Direct measurement: the size / flow meter data of the cooling load is calculated according to the total flow rate of the chilled water and the temperature difference of the chilled water in the chiller system
Indirect measurement: To predict the value of cooling load by establishing the fitting mo Deer of cooling load, as shown in the following formula:
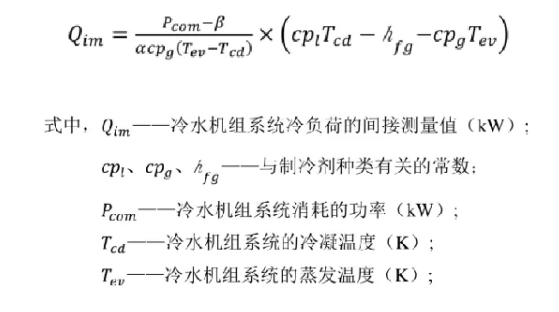
Among them, α and β are the coefficients of indirect measurement cold load fitting mo Deer, which can be fitted by historical measured data.
Key points of the data fusion algorithm
1) Test and remove the data outliers
Detection method: Compare the difference between the increment △Qdm of the direct measurement of cooling load at the current moment and the increment △Qim of the indirect measurement of cooling load at the same moment. If the difference between the increment △Qdm of the direct measurement of cooling load and the increment △Qim of the indirect measurement is greater than the defined threshold, it is considered that the cooling load at the current moment has improved. To enhance data quality, in the first step of data fusion, abnormal cooling load values need to be removed from numerous cooling load measurements; there are many detection methods, but a common approach is to use the increment judgment principle.
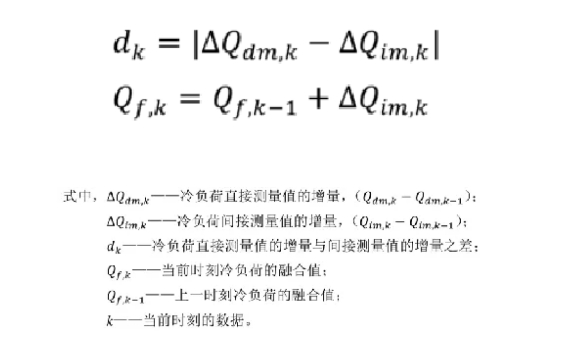
The direct load measurement is an outlier; otherwise, no outlier is considered. When the direct measurement value of cooling load is abnormal, the increment of the indirect measurement value of cooling load is used to obtain the size of the cooling load after fusion.
2) Reduce the influence of the noise in the measurement
If the direct measurement at the current moment is not an outlier, the moving window algorithm (sliding average) can be used to reduce the impact of the measurement noise.
3) Eliminate the influence of systematic errors
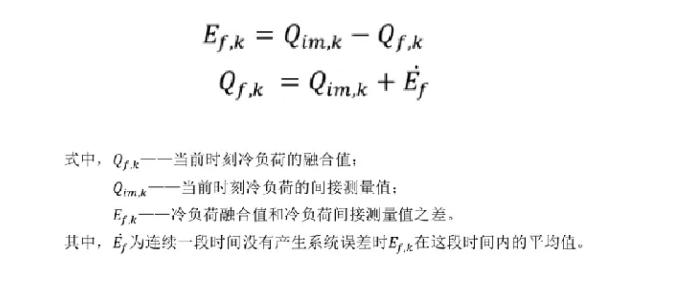
The systematic error often has an impact on the direct measurement value of the cooling load. Because the systematic error is relatively constant and changes slowly, the systematic error will gradually accumulate in Sdm and k, and then affects the accuracy of the cooling load fusion value. Therefore, the difference between the cooling load fusion value and the indirect measurement value of the cooling load is calculated to determine whether there is a systematic error, as shown in the following formula. If there is no systematic error, the difference fluctuates within a small range; if a systematic error occurs, the difference is beyond a reasonable fluctuation range
4) and confidence of data fusion
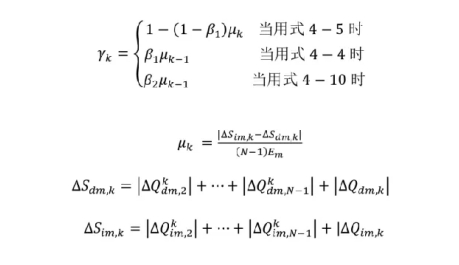
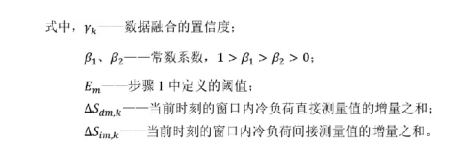
After completing the data fusion of cold load, it is necessary to evaluate the cold load fusion value obtained, so the confidence of data fusion is established to reflect the quality of cold load fusion value. The confidence ranges from 0 to 1, and the closer the confidence value is to 1, the higher the quality of the fusion value, the worse the quality is to the 0. In addition, by establishing the confidence of data fusion can be warned when the measurement quality of the value is very poor to facilitate the timely handling of emerging faults.
Q5 Base data analysis
Key points of data fitting:
(1) Data combing and analysis
(2) The construction form of the fitting function
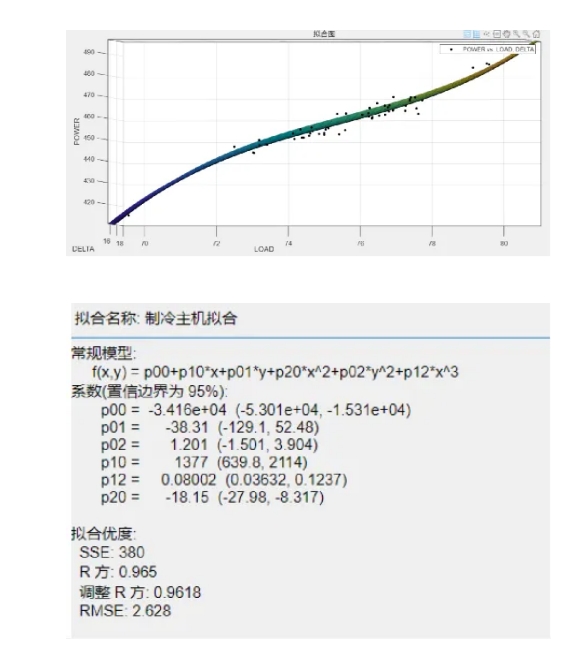
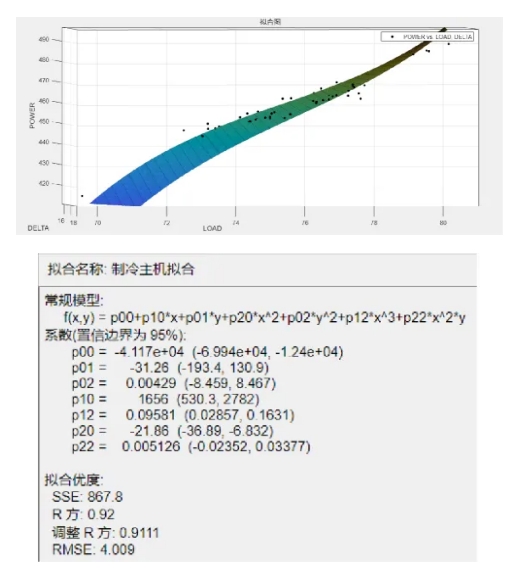
Equipment optimization strategy
With the help of Internet of things data collection means, can easily access to real-time operation data of refrigeration unit, including evaporation side of the water temperature, the unit running current and power, unit load rate (or current percentage), etc., through the continuous tracking of real-time data monitoring and comparative analysis, can be analyzed to the refrigeration capacity, loading rate, operation efficiency, so as to choose preferred better performance units put into use.
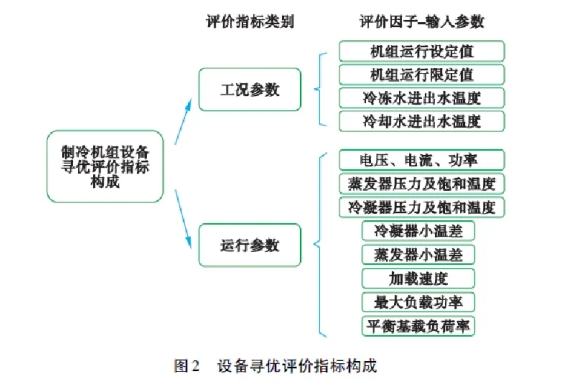
System-level data value point
1. Real-time data reflects the real-time operating conditions of the system and has high requirements for real-time process parameters in manufacturing; it is the urgent demand point of such customers. Similar to process control management (real-time tracking manufacturing link / parameter mutation forecast alarm function)
2. For large energy consumption enterprises, energy saving and cost reduction can be realized through optimized control strategies. But to energy consumption analysis, energy saving is based on high demand. Therefore, for this kind of enterprises, we need to do a solid energy consumption analysis, do accurate
3. An industry needs to have a depth to reflect its advantages. Take the efficient machine room as an example, the energy consumption analysis / energy consumption difference analysis is actually a blank;
4. Data value points of mathematical mo Deer system level:
There is still room for optimization in construction accuracy (from the perspective of fluid science, flow rate / resistance system construction mo Deer can better reflect the current real working conditions)

